Profiling PHP (Laravel)Applications with xhprof. Finding bottlenecks!
In today’s guide, we’re diving deep into the realm of PHP application profiling. We’ll explore key techniques to enhance performance and identify what’s slowing down your applications.
Hey PHP devs!
Ever felt frustrated when your app runs slow, but you just can’t pinpoint where the problem is? It’s like trying to find a needle in a haystack, right? Well, not anymore! In today’s guide, we’re going to dive into the world of PHP application profiling. We’ll show you how to stop guessing and start identifying the real bottlenecks that are dragging your application down. Get ready to give your app the speed boost it deserves with some cool profiling tools like xhprof and Buggregator. Let’s get your PHP applications running smoothly and efficiently!
First off, let’s talk about what a “bottleneck” is. It’s basically a point in your app where things slow down due to inefficient code, not enough system resources, or other external snags like network delays. These bottlenecks can really slow down your app’s performance and response time.

Here are some usual suspects for bottlenecks in PHP applications:
- Database Queries — If your queries are slow or very complex, they can really make your app slow, especially if they’re handling lots of data.
- Inefficient Code — Poorly written code that uses too many resources can slow things down a lot.
- External Services — If your app relies on outside services or APIs that are slow, this can also be a big problem for your app’s speed.
What’s a Profiler Anyway?
A profiler is like a detective for your code. It tracks program events as they happen, studying how they affect your system. This might include memory and CPU usage, but some go deeper, capturing full function call traces and compiling detailed data. Whether they’re analyzing each function solo or within a broader context, profilers help us see the bigger picture.
Today, let’s talk about xhprof. It’s a well-known profiler that can clue you in on memory usage, CPU load, and call counts, helping spot your app’s bottlenecks.
PHP has several profiling tools available, like xhprof gui, Blackfire and Buggregator.
Xhprof gui: A Closer Look
Xhprof might be a go-to for many because it’s open-source. However, it hasn’t been updated in over 9 years, making it a bit of a dinosaur with limited features. Setting it up can be a pain. There are Docker images available, but it’s not the easiest to get started with.

Blackfire: The Premium Choice
Then there’s Blackfire. It’s slick, but it’s not free. Starting at $30 a month, it might not be something you’ll use every day. Usually, profiling is a once-in-a-while task: run it, check the trace, optimize the slow calls, and then you’re done. Paying that much for occasional use? Probably too much for most of us, especially if you’re just tweaking your personal blog. However, for continuous monitoring in production, Blackfire could be worth it.

Buggregator!
Now, let’s switch gears and talk about Buggregator. I’ve previously described it as a Swiss Army knife for PHP developers — it’s got everything you need to debug PHP applications. Best of all, Buggregator is open source and completely free. No fees, no extra extensions — just set it up and get going.
First up, let’s dive into an introduction video to explore Buggregator’s profiling module.
Today, I want to dive into this specially designed module for profiling PHP applications using the xhprof extension.
Let’s get started!
Setup Application
We’ll start by setting up a Laravel project.
Run the following command in your terminal:
composer create-project laravel/laravel my-appNext, let’s add a composer package to send Xhprof profiles to Buggregator for better analysis:
composer require --dev maantje/xhprof-buggregator-laravelShoutout to maantje for integrating Buggregator profiler with Laravel — don’t forget to star his repo!
For Xhprof to communicate with Buggregator, set these environment variables in your project:
PROFILER_ENDPOINT=http://buggregator:8000/api/profiler/store
XHPROF_ENABLED=true
Here, buggregator:8000 refers to the Buggregator container address in Docker.
Setting this up is super simple, right? For more detailed setup and configuration instructions, check out the official documentation at Buggregator Docs.
Setting Up the Docker Environment
Now, let’s create a Dockerfile to define the environment where our app will run. Here's how my .docker/Dockerfile looks:
FROM php:8.3-alpine

RUN apk add --no-cache \
    curl \
    curl-dev \
    libzip-dev \
    linux-headers \
    pcre-dev \
    ${PHPIZE_DEPS}

RUN pecl install xhprof

RUN docker-php-ext-configure curl
RUN docker-php-ext-configure zip

RUN docker-php-ext-install \
    opcache \
    curl \
    pcntl \
    sockets \
    zip

RUN docker-php-ext-enable \
    xhprof \
    opcache

WORKDIR /app

EXPOSE 8000

CMD php artisan serve
Next, create a docker-compose.yaml at the root of your Laravel project to describe all necessary services:
version: '3.1'

services:
  my-app:
    build: "./.docker"
    labels:
      - "traefik.enable=true"
      - "traefik.http.routers.my-app-http.entrypoints=web"
      - "traefik.http.routers.my-app-http.rule=Host(`my-app.localhost`)"
      - "traefik.http.services.my-app-http.loadbalancer.server.port=8000"
    volumes:
      - ./:/app
    networks:
      - my-network

  buggregator:
    container_name: my-buggregator
    image: ghcr.io/buggregator/server:latest
    labels:
      - "traefik.enable=true"
      - "traefik.http.routers.buggregator-http.entrypoints=web"
      - "traefik.http.routers.buggregator-http.rule=Host(`buggregator.localhost`)"
      - "traefik.http.services.buggregator-http.loadbalancer.server.port=8000"
    logging:
      driver: none
    networks:
      - my-network

  reverse-proxy:
    container_name: my-reverse-proxy
    image: traefik:v2.9
    command:
      - "--providers.docker=true"
      - "--providers.docker.exposedbydefault=false"
      - "--entrypoints.web.address=:80"
      - "--providers.file.watch=true"
    ports:
      - ${TRAEFIC_PORT_HTTP:-80}:80
    volumes:
      - /var/run/docker.sock:/var/run/docker.sock
    logging:
      driver: none
    networks:
      - my-network

networks:
  my-network:
    ipam:
      driver: default
      config:
        - subnet: 172.0.70.0/24
In this setup, I’m also using traefik as a reverse proxy to bind our service addresses to DNS entries my-app.localhost and buggregator.localhost for easy access.
Running Our Services
Launch your Docker environment with:
docker compose upOnce everything is up and running, you can check that your services are working correctly by visiting:
Now that everything is set up, let’s dive deep into profiling to see what’s going on.
Every time we access our application, xhprof creates a profile of the HTTP request. This profile will be sent to Buggregator, where it will be analyzed and saved.
What Buggregator offers
Buggregator offers several ways to display the results of profile analysis. Let’s explore how they can help us identify performance bottlenecks.
Call Graph
This shows your function calls in a tree layout where nodes change color from white to dark red. The darker the node, the more resources it’s hogging. This helps you spot quickly which parts of your code are resource hogs and need tuning up.
For example, the Call Graph lets you see the whole call tree, understand who calls whom, how methods interact, how many calls there are, etc.
Let’s check it out in action. I refreshed a website page a few times.

As you can see from the screenshot above, the first load took about 57ms because the app’s cache wasn’t warmed up yet, but subsequent calls are around 15ms. Pretty good, right?
Now, let’s look at the call graph. Let’s turn on the Wall time graph in the metric switcher on the left. We have four types of metrics:
- CPU — the amount of CPU time spent on a request.
- Wall Time (wt) — CPU time plus time spent waiting for network, disk, etc., including functions like
\sleep. - Memory (mu) — the amount of memory needed for a request.
- Peak Memory Usage (pmu) — maximum memory used

As we can see, there’s a lot going on, but there could be even more if we set the threshold to 0.
Turns out our application made a ton of calls, but we’re not interested in all of them because many use very little resources compared to the heavy hitters. By changing the threshold, we can filter out the ones that aren’t interesting. Changing the percent value turns on or off the highlighting of blocks that use more resources than the specified value.

Now, let’s move to the FlameGraph.
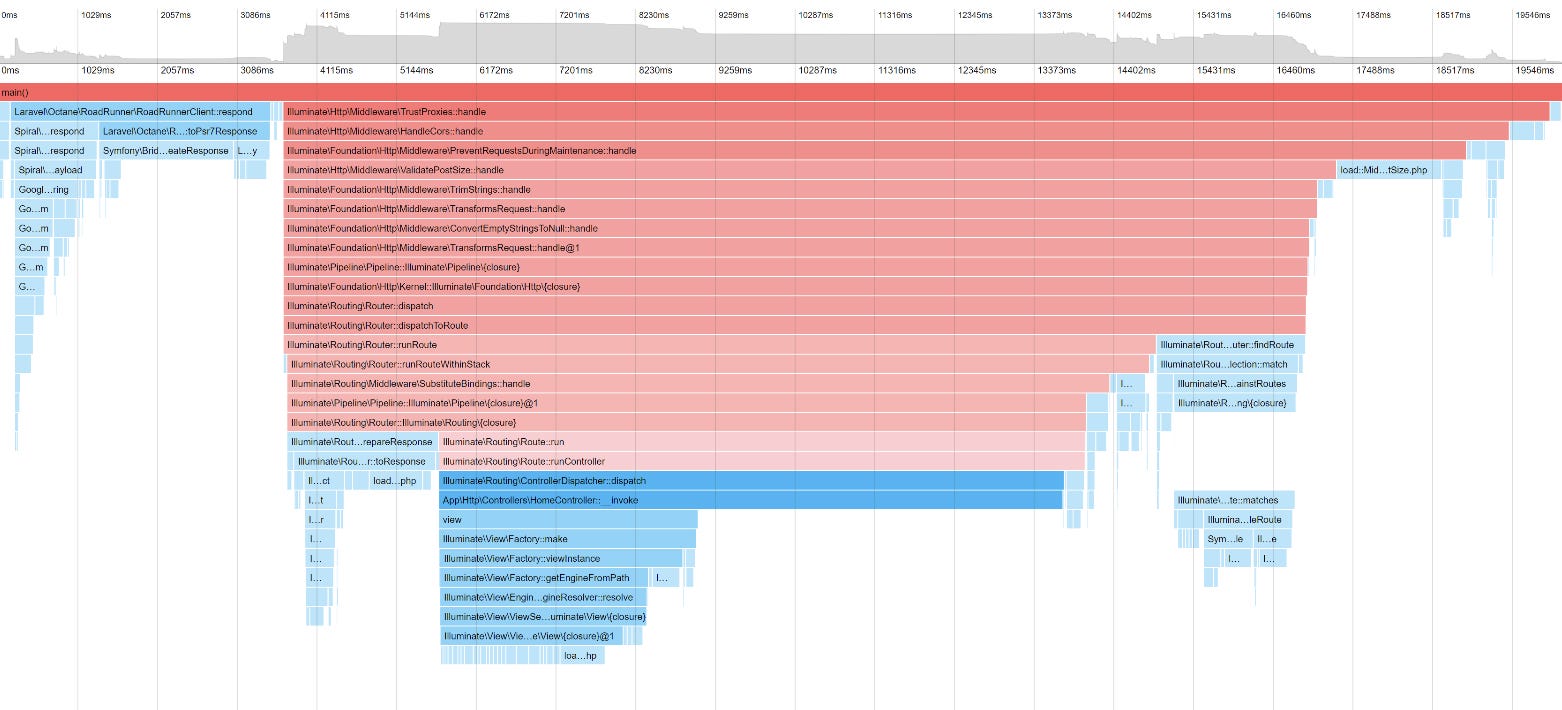
FlameGraph
This graphical representation shows a stack of function calls. It displays which functions call other functions. It’s really handy for spotting repetitive or time-consuming tasks that might not stand out at first glance. The FlameGraph helps you see how functions connect and where your application is spending the most time. This makes it easier to focus on specific areas that might need some tweaking for better performance.

Here, we can see our function calls as span blocks. The bigger and redder the block, the more time it’s taking to execute. Usually, in this graph, you look from the top down. From the graph, it’s clear that the call to Illuminate\Database\Connection::Illuminate\Database\{closure} is a bit off to the side, but it's still the lowest and takes up the most Wall time.
Now, let’s check out the top 100 functions.
Top 100 Functions
This table showcases the top 100 function calls that consume the most resources, offering a focused list of potential problem areas. This allows you to prioritize optimizations in your application where they’ll have the most impact on performance.

By clicking on the column names, you can sort the list based on the selected metric. The list displays the total resources each listed function has consumed. The postfix excl. stands for Exclusive.
Memory usage and CPU time are categorized into ‘Inclusive’ and ‘Exclusive’.
- Inclusive — Time includes the duration spent within the function itself and all its child functions.
- Exclusive — Time measures only the duration spent in the function itself, excluding time in child function calls.
In our case, this table also highlights that Illuminate\Database\Connection::Illuminate\Database\{closure} has the most significant impact on query execution time.
Profiling Process
Let’s disable this function call.
As we can see from the flamechart below, the DB is required for sessions and currently, we are using the SESSION_DRIVER=database.
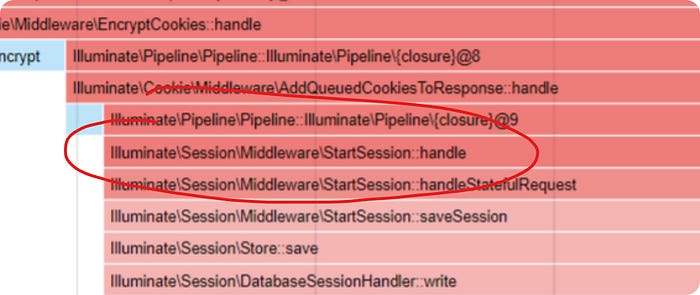
Let’s switch to SESSION_TRANSFER=file and see what happens.

As we can see, the DB query did not execute, and the Wall time dropped to ~4ms. Congratulations, we've found our first bottleneck!
The CPU stopped using resources for processing the HTTP request altogether.
Let’s look at the flamechart again.

We see that sessions and cookies are still consuming resources. Let’s try removing the middleware entirely. Here’s what the profiler showed.

As we can see, we reduced the time to ~2ms per request.
Memory Leaks
Finally, let’s work with memory and search for memory leaks, which is very important for long-running applications.
First, let’s install Laravel Octane.
composer require laravel/octane
php artisan octane:install
I chose RoadRunner as the server.
Let’s modify the Dockerfile a bit.
...

CMD php artisan octane:start --host=0.0.0.0 --workers=1
And rebuild our image.
docker compose build
docker compose up
So after launching, I saw that our resource consumption increased:

As we can see, several operations have been added.

I highlighted the work with RoadRunner in red, and you can partially optimize the speed by installing the protobuf extension for PHP.
I highlighted the work with the View component in green because it seems to be inefficient in LongRunning.
So, we’ve launched the application. Let’s now simulate memory leaks.
Let’s start with this controller and look at several HTTP calls to it.
final class HomeController extends Controller
{
    private array $data = [];

    public function __invoke()
    {
        foreach (range(1, 10_000) as $i) {
            $this->data[] = [
                'id' => $i,
                'name' => 'Name ' . $i,
                'email' => 'email' . $i . '@gmail.com',
            ];
        }

        return view('welcome');
    }
}
As we can see, the first request (the lowest one) spent ~6mb (Peak memory usage), i.e., recorded 10,000 elements in memory, and then nothing else is written. So, we have ~6mb stored in memory and no more is being added.
This is because HomeController is not a singleton and does not persist state between requests.
Now let’s add 10,000 elements to a static variable.
final class HomeController extends Controller
{
    private static $data = [];

    public function __invoke()
    {
        foreach (range(1, 10_000) as $i) {
            self::$data[] = [
                'id' => $i,
                'name' => 'Name ' . $i,
                'email' => 'email' . $i . '@gmail.com',
            ];
        }

        return view('welcome');
    }
}
As we can see, now in each new request, we see in Peak Memory Usage not 0, but ~4mb, which indicates that there is a change in memory, i.e., peak memory consumption continuously changes upwards, i.e., grows by the specified amount.

Now let’s look at the CallGraph, the Memory Peak metric.

In the tree, we see the path to our controller. In our example, I specifically took a large number of elements because it clearly shows the leak. With smaller leaks, it might be a bit more challenging, but they can be identified.
Let’s now look at the Top functions.

Here we can also sort by PMU Excl. and see where changes occur.
That’s all, I hope the information was helpful. Thx for reading!
In conclusion, if you’re looking for an all-in-one solution to profile, debug, and enhance your PHP applications, Buggregator is definitely worth checking out. It’s more than just a profiler; it’s an essential part of your development toolkit, helping you understand and improve your application’s performance with ease.
If you’ve found Buggregator helpful, please consider giving it a star on GitHub. Your support really makes a difference and helps more developers discover and benefit from this tool. Thanks a bunch for your support! 🌟
Github repository: https://github.com/buggregator/server
Website: https://buggregator.dev
Here is also an introduction video of Buggregator